Apparatus Photos |
||
 |
Table of Contents 1. March 1998 |
|||
1. March 1998 |
||
|
|||

|
|
|||||


2. June 1998 |
||


3. Volume Holographic July 1999 |
||
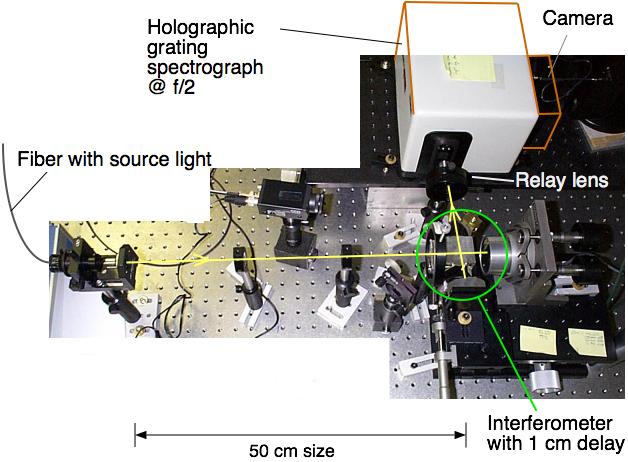
Photo of EDI built by Erskine July 1999 using a volume holographic grating spectrograph from HoloSpec Inc., which advertised 80% throughput, Res = 5000 over a 900 Å bandwidth in the green. In this apparatus a piggyback HeNe laser cavity stabilization was tested. The small black TV CCD observed red HeNe fringes reflected from a mirror mounted on a small brass piece very close to the beamsplitter cube. Although this spectrograph had very much higher diffraction efficiency than the Jobin-Yvon spectrograph of the other EDI, the smoothly adjustable slit width and adjustable center wavelength of the Jobin-Yvon made it more convenient for proof of principle experiments. So the Jobin-Yvon version was chosen to bring to Lick in Dec 1999 for starlight testing. |
||
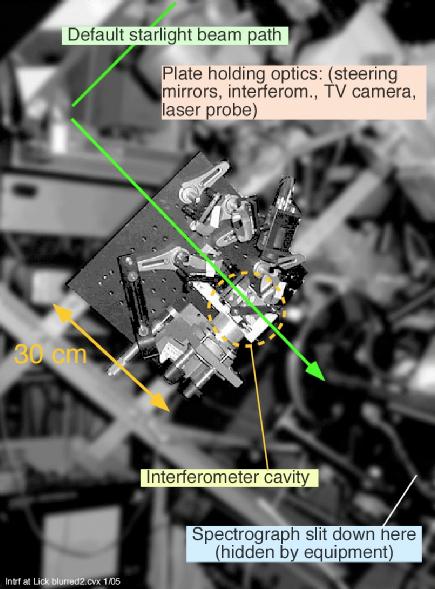
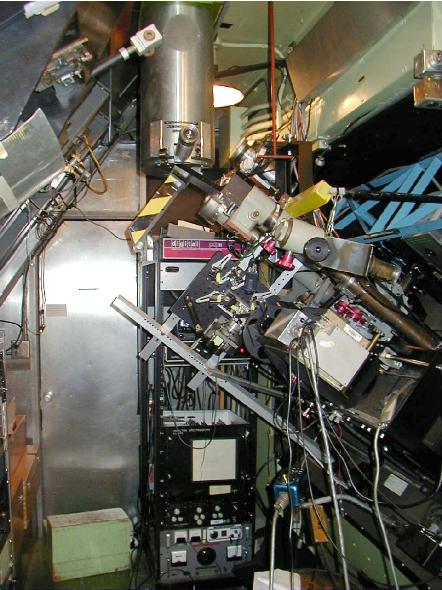
4. Lick Obs. 1 meter 1999 |
||
|
||
|
||
5. Spectral Astrometry demo 2001 |
||
|
||
6. Lick Obs. Hamilton echelle spectrograph EDI 2002 |
||
 |
 |
|||
|
||
7. Demonstrated 6x res boosting Oct 2003 multiple delay scheme could be used. |
||
|
||||
|
||||


Site maintained by |
||||